Foreign Direct Investment by Country
About this statistic
Foreign direct investment flowing into the country
Full world ranking
| 1 |  | United States | $361.9B |
| 2 |  | Singapore | $132.5B |
| 3 |  | Germany | $77.4B |
| 4 |  | Brazil | $62.8B |
| 5 |  | China | $51.3B |
| 6 |  | Spain | $47.0B |
| 7 |  | Canada | $43.9B |
| 8 |  | Italy | $42.0B |
| 9 |  | Poland | $35.7B |
| 10 |  | Australia | $35.3B |
| 11 |  | Mexico | $30.7B |
| 12 |  | United Arab Emirates | $30.7B |
| 13 |  | India | $28.1B |
| 14 |  | Argentina | $24.8B |
| 15 |  | Malta | $24.6B |
| 16 |  | Saudi Arabia | $22.8B |
| 17 |  | Indonesia | $21.5B |
| 18 |  | Japan | $20.0B |
| 19 |  | South Korea | $19.0B |
| 20 |  | Sweden | $18.7B |
| 21 |  | Vietnam | $18.5B |
| 22 |  | Chile | $18.4B |
| 23 |  | France | $18.1B |
| 24 |  | Colombia | $16.8B |
| 25 |  | Israel | $16.2B |
| 26 |  | United Kingdom | $13.8B |
| 27 |  | Norway | $13.8B |
| 28 |  | Oman | $12.5B |
| 29 |  | Czechia | $11.9B |
| 30 |  | Portugal | $11.6B |
| 31 |  | Turkey | $10.7B |
| 32 |  | Thailand | $10.3B |
| 33 |  | Egypt | $9.8B |
| 34 |  | Denmark | $9.0B |
| 35 |  | Philippines | $8.9B |
| 36 |  | Romania | $8.7B |
| 37 |  | Malaysia | $7.9B |
| 38 |  | Bahrain | $7.2B |
| 39 |  | Kazakhstan | $5.7B |
| 40 |  | Estonia | $5.2B |
| 41 |  | Bulgaria | $5.2B |
| 42 |  | Serbia | $4.9B |
| 43 |  | Senegal | $4.8B |
| 44 |  | Dominican Republic | $4.8B |
| 45 |  | Greece | $4.7B |
| 46 |  | Costa Rica | $4.7B |
| 47 |  | Ukraine | $4.6B |
| 48 |  | New Zealand | $4.4B |
| 49 |  | Peru | $4.3B |
| 50 |  | Cambodia | $4.0B |
| 51 |  | South Africa | $3.9B |
| 52 |  | Lithuania | $3.8B |
| 53 |  | Croatia | $3.3B |
| 54 |  | Ethiopia | $3.3B |
| 55 |  | Uganda | $3.0B |
| 56 |  | Austria | $2.9B |
| 57 |  | Mozambique | $2.7B |
| 58 |  | Ivory Coast | $2.5B |
| 59 |  | Panama | $2.4B |
| 60 |  | DR Congo | $2.4B |
| 61 |  | Namibia | $2.3B |
| 62 |  | Mongolia | $2.2B |
| 63 |  | Uzbekistan | $2.2B |
| 64 |  | Kuwait | $2.1B |
| 65 |  | Georgia | $2.1B |
| 66 |  | Pakistan | $2.0B |
| 67 |  | Jordan | $2.0B |
| 68 |  | Belarus | $2.0B |
| 69 | 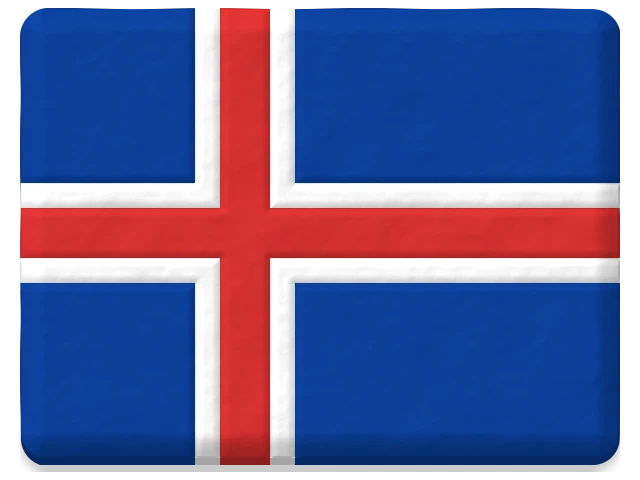 | Iceland | $1.9B |
| 70 | 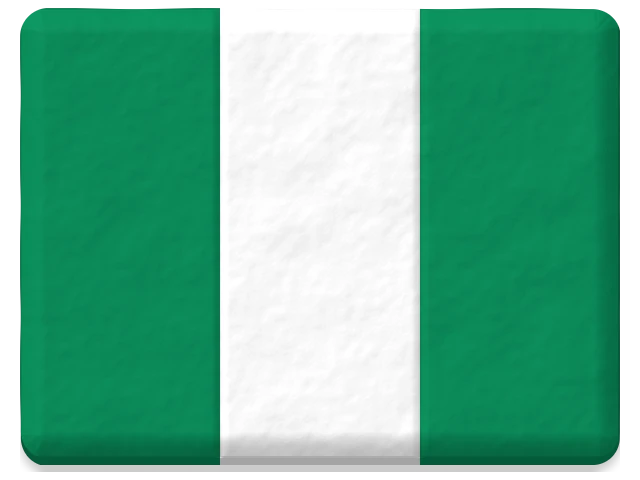 | Nigeria | $1.9B |
| 71 | 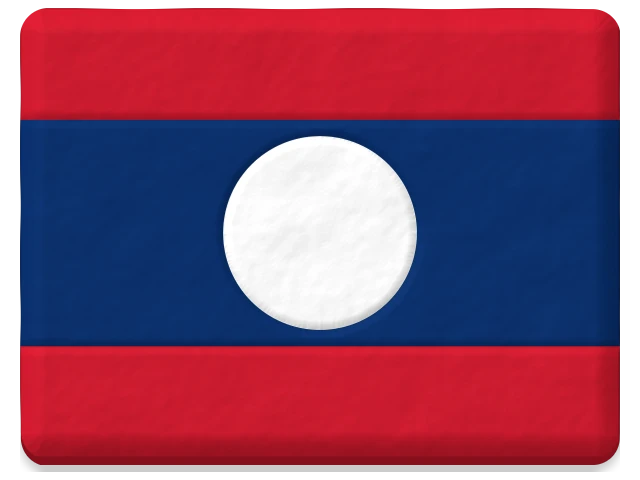 | Laos | $1.8B |
| 72 | 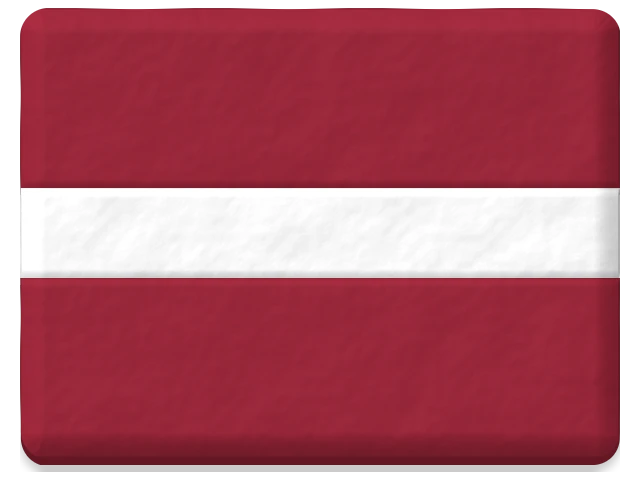 | Latvia | $1.7B |
| 73 |  | Guatemala | $1.7B |
| 74 |  | Tanzania | $1.6B |
| 75 |  | Albania | $1.6B |
| 76 |  | Myanmar | $1.5B |
| 77 |  | Bangladesh | $1.5B |
| 78 |  | Slovenia | $1.4B |
| 79 |  | Iran | $1.4B |
| 80 |  | Turkmenistan | $1.4B |
| 81 |  | Ghana | $1.3B |
| 82 |  | Guinea | $1.3B |
| 83 |  | Algeria | $1.2B |
| 84 |  | Gabon | $1.2B |
| 85 |  | Bosnia and Herzegovina | $1.1B |
| 86 |  | Nicaragua | $1.1B |
| 87 |  | Paraguay | $1.1B |
| 88 |  | Honduras | $1.1B |
| 89 | 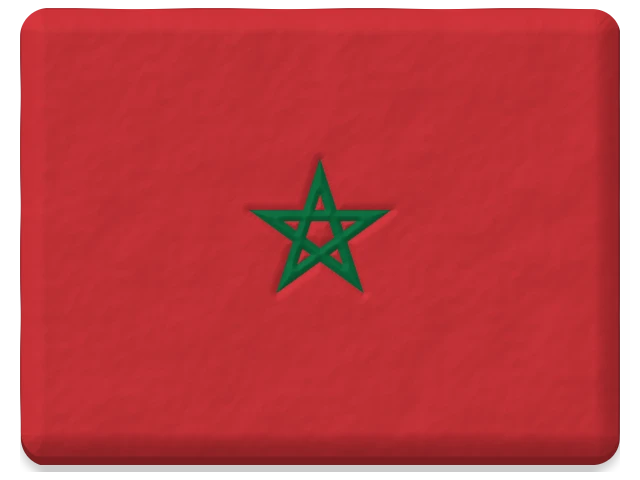 | Morocco | $1.1B |
| 90 | 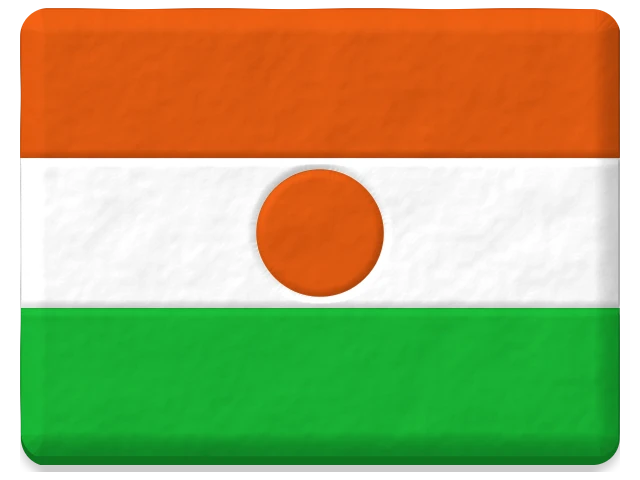 | Niger | $1.0B |
| 91 | 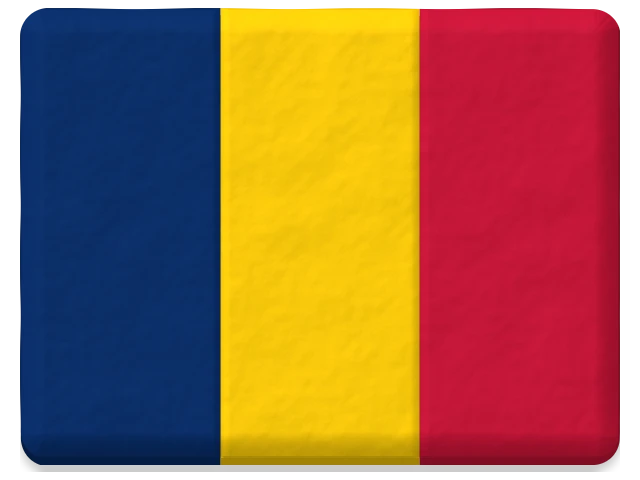 | Chad | $913.3M |
| 92 | 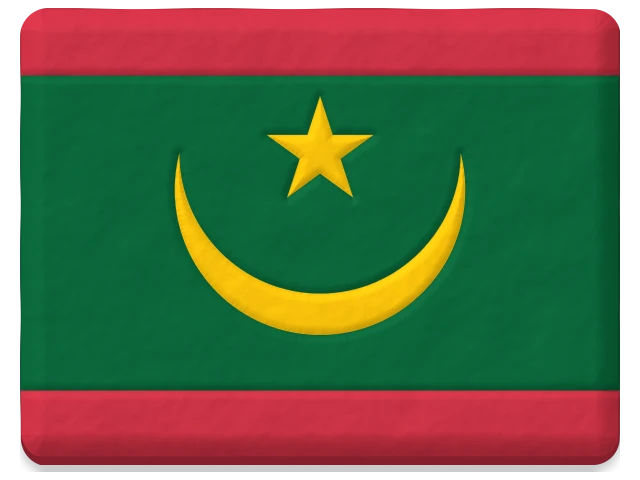 | Mauritania | $848.4M |
| 93 |  | Cameroon | $821.5M |
| 94 |  | Libya | $794.7M |
| 95 |  | Maldives | $766.8M |
| 96 |  | Mauritius | $759.8M |
| 97 |  | Malawi | $759.8M |
| 98 |  | Botswana | $741.5M |
| 99 |  | Sri Lanka | $713.0M |
| 100 |  | Tunisia | $705.5M |
| 101 |  | Mali | $702.6M |
| 102 |  | Somalia | $676.5M |
| 103 |  | Lebanon | $655.4M |
| 104 |  | El Salvador | $643.0M |
| 105 | 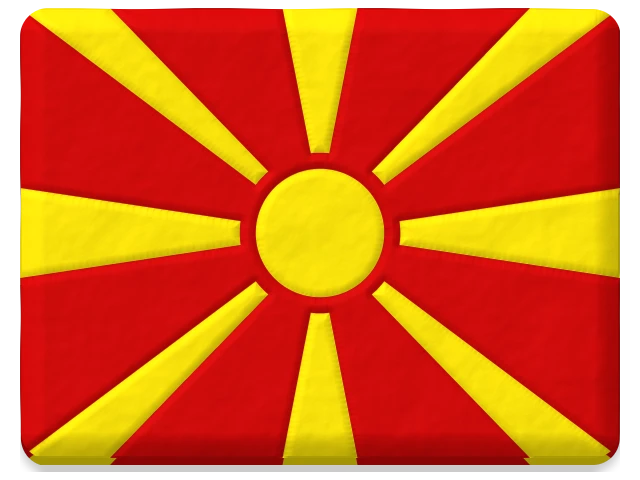 | North Macedonia | $641.5M |
| 106 | 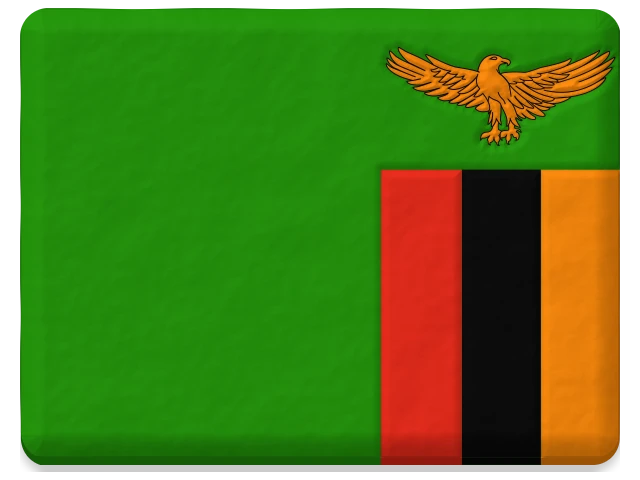 | Zambia | $641.1M |
| 107 | 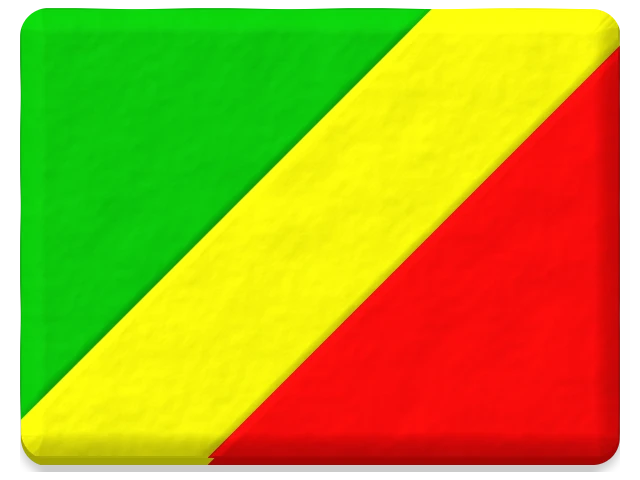 | Republic of the Congo | $626.5M |
| 108 | 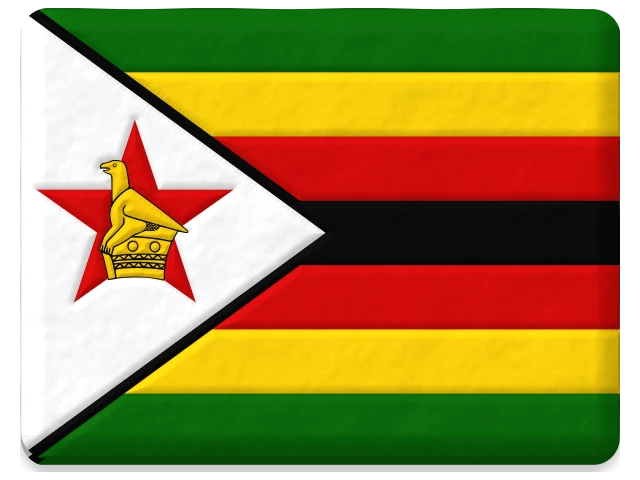 | Zimbabwe | $604.2M |
| 109 |  | Armenia | $580.4M |
| 110 |  | Sudan | $548.2M |
| 111 |  | Slovakia | $526.1M |
| 112 |  | Montenegro | $525.9M |
| 113 |  | Madagascar | $519.5M |
| 114 |  | Kenya | $508.0M |
| 115 |  | Jamaica | $492.4M |
| 116 |  | Ecuador | $481.0M |
| 117 |  | Rwanda | $457.6M |
| 118 |  | Benin | $443.0M |
| 119 |  | Moldova | $360.9M |
| 120 |  | Bahamas | $322.5M |
| 121 |  | Liberia | $312.3M |
| 122 |  | Antigua and Barbuda | $293.0M |
| 123 |  | Andorra | $275.8M |
| 124 |  | Azerbaijan | $252.8M |
| 125 |  | Bolivia | $240.1M |
| 126 |  | Seychelles | $239.7M |
| 127 |  | Barbados | $224.9M |
| 128 |  | Grenada | $220.3M |
| 129 | 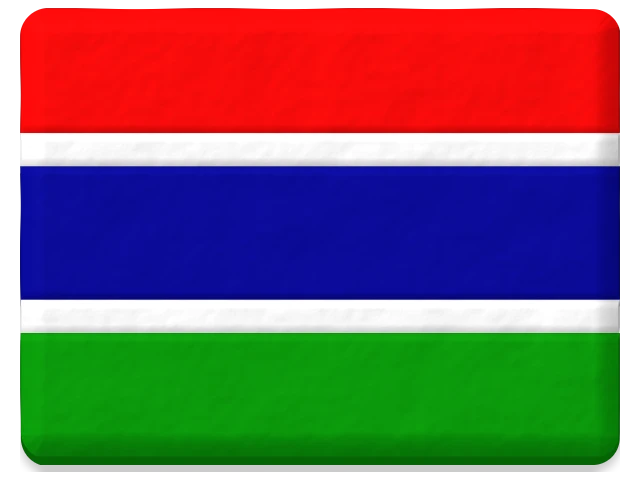 | Gambia | $205.5M |
| 130 | 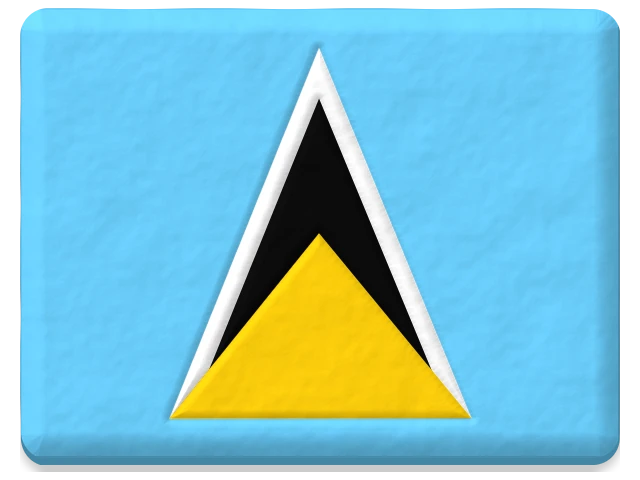 | Saint Lucia | $203.1M |
| 131 | 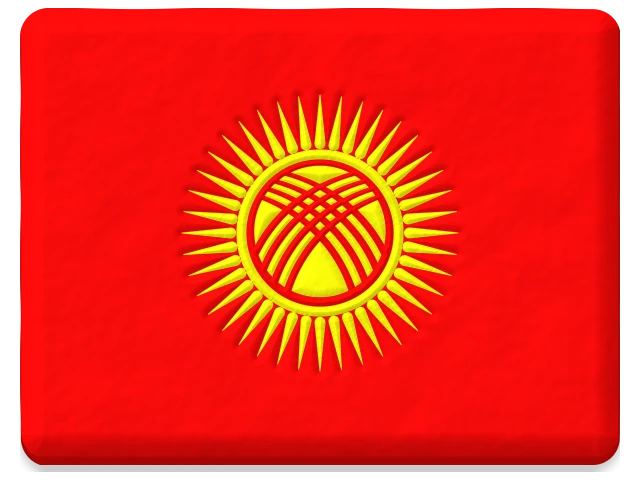 | Kyrgyzstan | $159.0M |
| 132 | 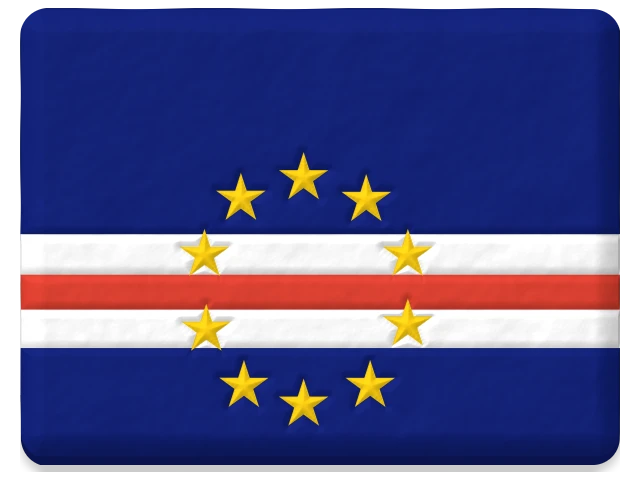 | Cape Verde | $158.7M |
| 133 |  | Sierra Leone | $145.9M |
| 134 |  | Equatorial Guinea | $141.8M |
| 135 |  | Tajikistan | $140.6M |
| 136 |  | Djibouti | $137.0M |
| 137 |  | Timor-Leste | $122.2M |
| 138 |  | Burkina Faso | $109.4M |
| 139 |  | Palestine | $103.5M |
| 140 |  | Fiji | $90.6M |
| 141 |  | Palau | $79.9M |
| 142 |  | Togo | $79.7M |
| 143 |  | Solomon Islands | $78.9M |
| 144 |  | Nepal | $74.8M |
| 145 |  | Saint Vincent and the Grenadines | $73.8M |
| 146 |  | Dominica | $48.0M |
| 147 |  | Papua New Guinea | $43.3M |
| 148 |  | Central African Republic | $38.7M |
| 149 |  | Burundi | $34.0M |
| 150 | 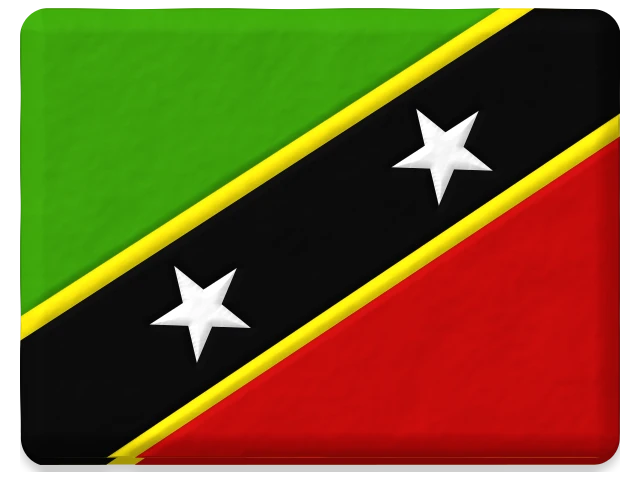 | Saint Kitts and Nevis | $29.8M |
| 151 | 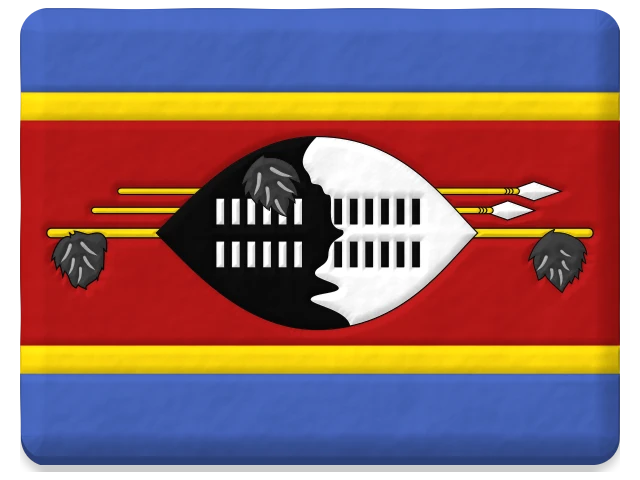 | Eswatini | $28.1M |
| 152 | 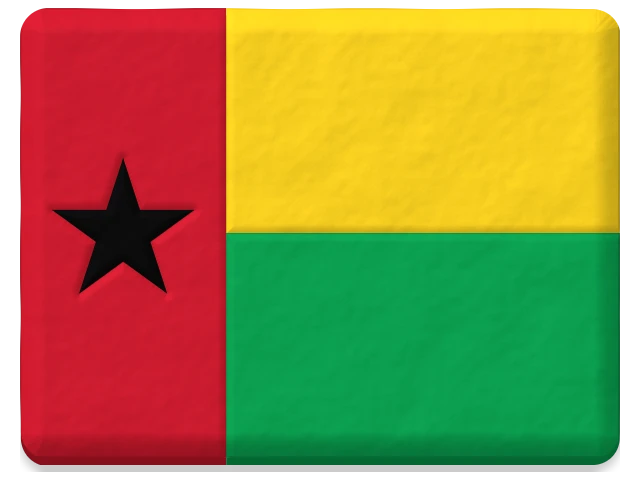 | Guinea-Bissau | $25.1M |
| 153 | 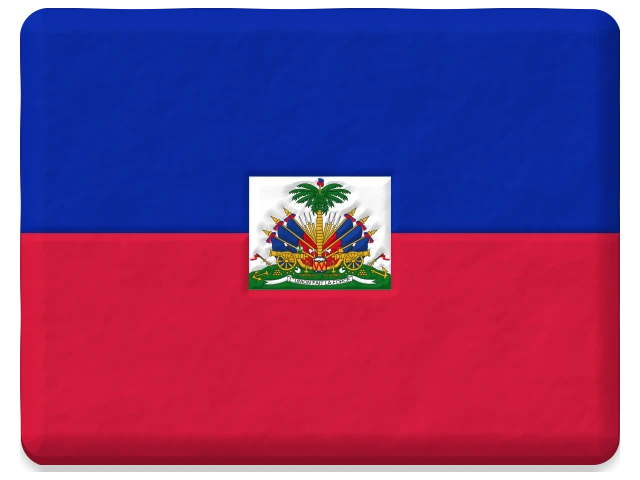 | Haiti | $23.6M |
| 154 |  | Afghanistan | $20.6M |
| 155 |  | Belize | $16.0M |
| 156 |  | Venezuela | $13.0M |
| 157 |  | Bhutan | $10.2M |
| 158 | 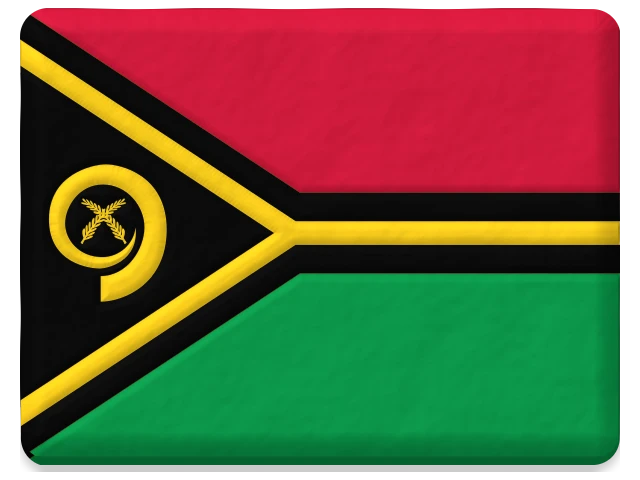 | Vanuatu | $9.3M |
| 159 | 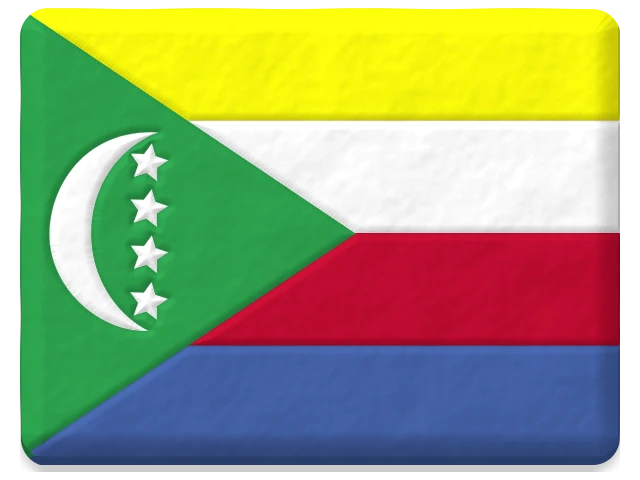 | Comoros | $5.4M |
| 160 | 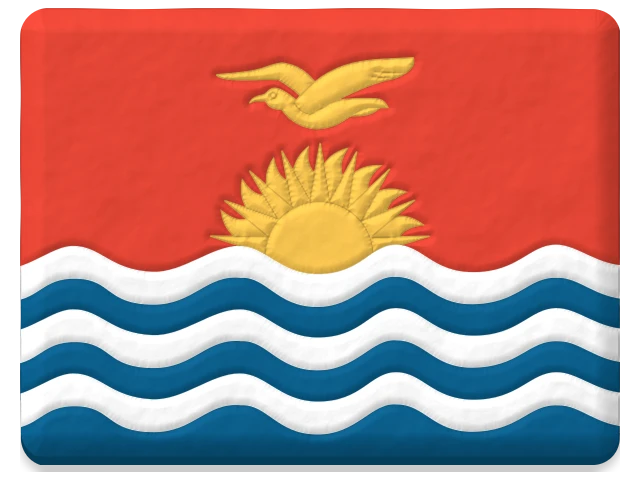 | Kiribati | $5.1M |
| 161 | 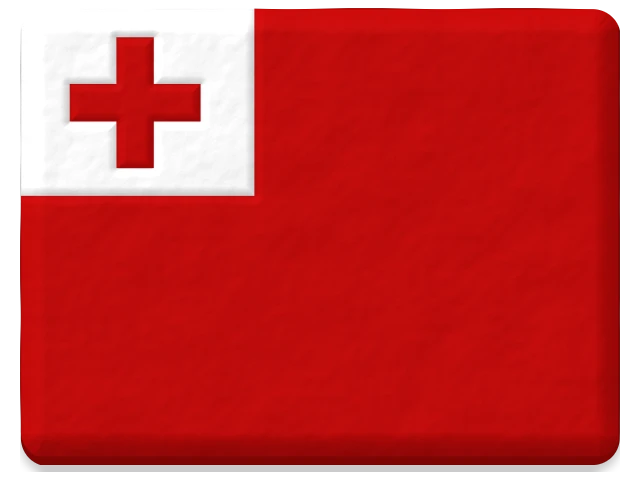 | Tonga | $2.6M |
| 162 |  | Samoa | $2.4M |
| 163 |  | Eritrea | $2.1M |
| 164 |  | Marshall Islands | $2.0M |
| 165 |  | Nauru | $1.4M |
| 166 | 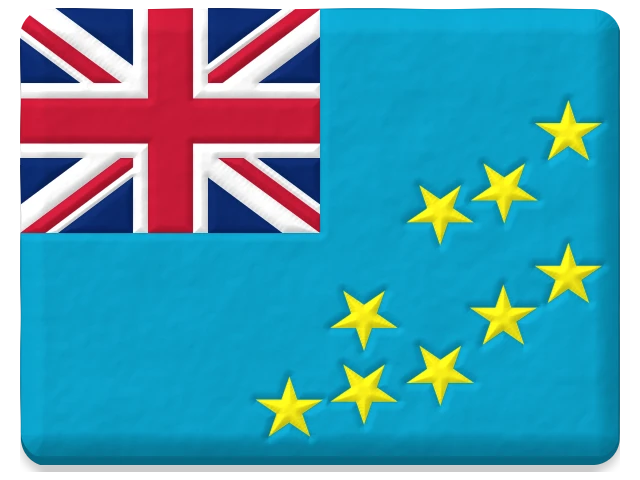 | Tuvalu | $166.3K |
| 167 | 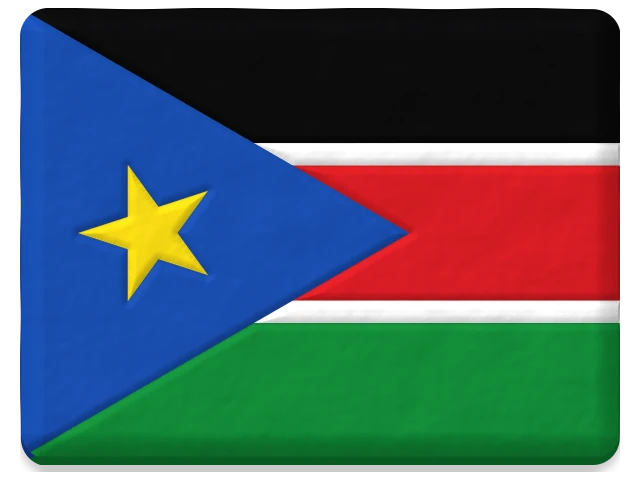 | South Sudan | -$6.3M |
| 168 | 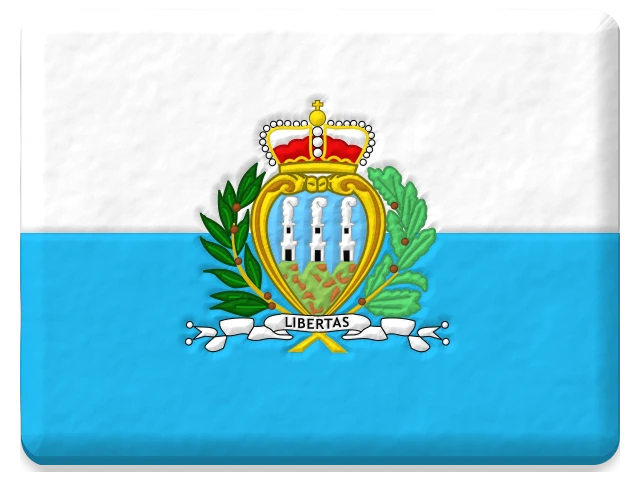 | San Marino | -$18.1M |
| 169 | 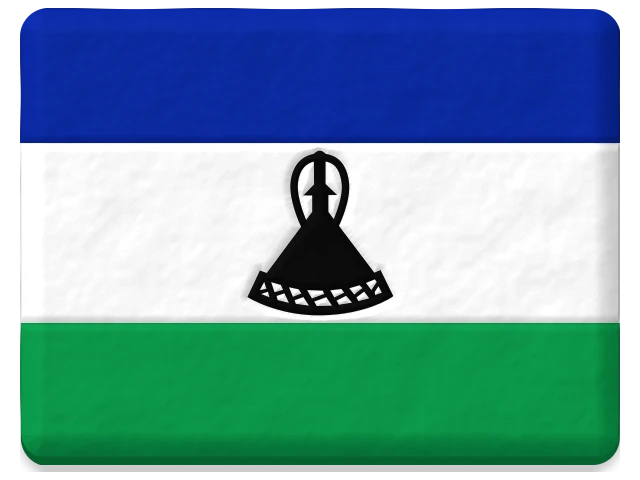 | Lesotho | -$25.6M |
| 170 |  | São Tomé and Príncipe | -$25.8M |
| 171 |  | Suriname | -$53.1M |
| 172 |  | Brunei | -$55.9M |
| 173 |  | Finland | -$114.8M |
| 174 |  | Yemen | -$371.0M |
| 175 |  | Qatar | -$474.2M |
| 176 |  | Guyana | -$1.1B |
| 177 |  | Trinidad and Tobago | -$1.5B |
| 178 |  | Angola | -$2.1B |
| 179 |  | Belgium | -$4.2B |
| 180 |  | Uruguay | -$5.2B |
| 181 |  | Iraq | -$5.4B |
| 182 |  | Luxembourg | -$9.3B |
| 183 |  | Russia | -$10.0B |
| 184 |  | Cyprus | -$22.2B |
| 185 |  | Hungary | -$70.8B |
| 186 |  | Switzerland | -$115.5B |
| 187 |  | Ireland | -$140.0B |
| 188 |  | Netherlands | -$343.4B |
Source
World Bank · 2022 · 188/195 countries
Surprising positions
Russia ranks 183 of 188 for foreign direct investment, and 9 of 195 for population.
Iraq ranks 181 of 188 for foreign direct investment, and 35 of 195 for population.
Malta ranks 15 of 188 for foreign direct investment, and 166 of 195 for population.